Welcome to Grid Brief! Today we’re looking at power generation, demand, prices, and more in America’s power markets.
What’s Keeping the Lights On?
Let’s start with a snapshot of generation nation-wide:
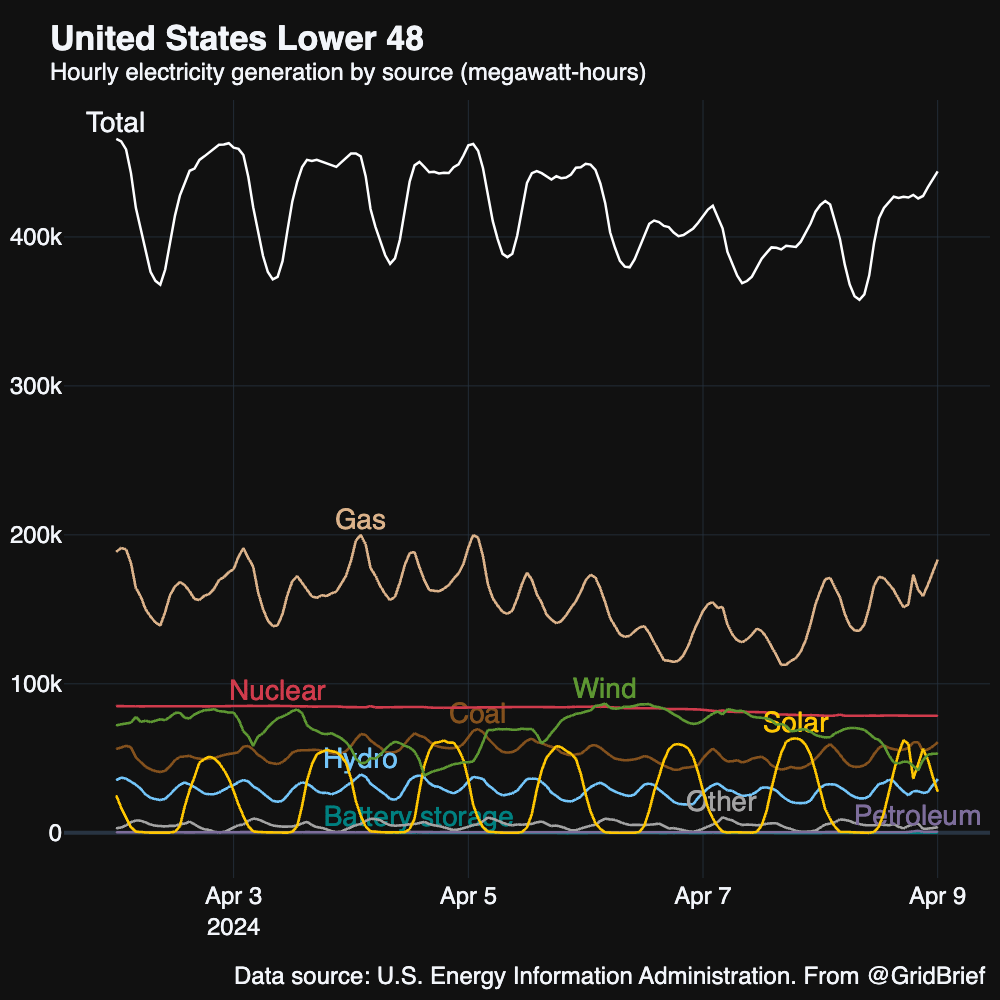
The national top three generators saw a little more diversity than usual as wind jumped over nuclear several times to claim fission’s usually stable second place spot.
And here’s a map to orient you as we move through the market areas:

ISO-NE
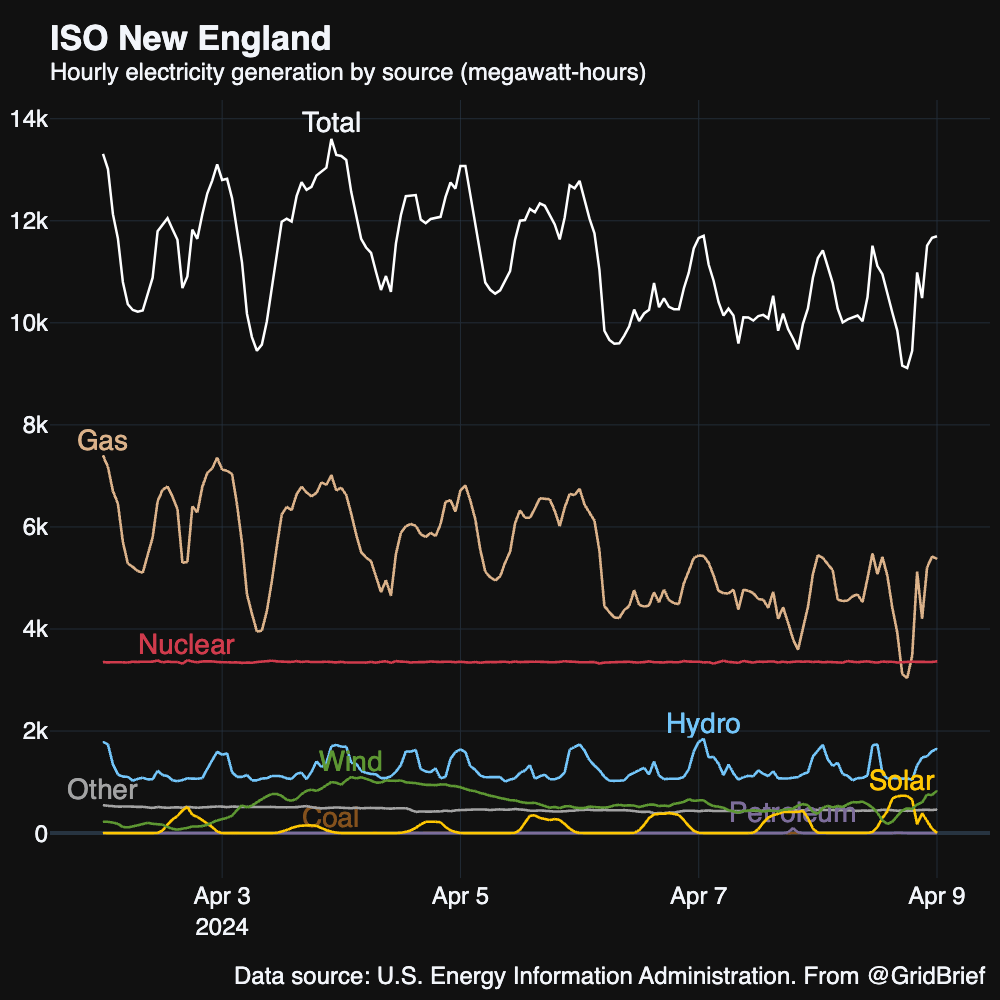
New England saw total generation ebb over the week as demand fell, but the top three spots still belonged to natural gas, nuclear, and hydro.

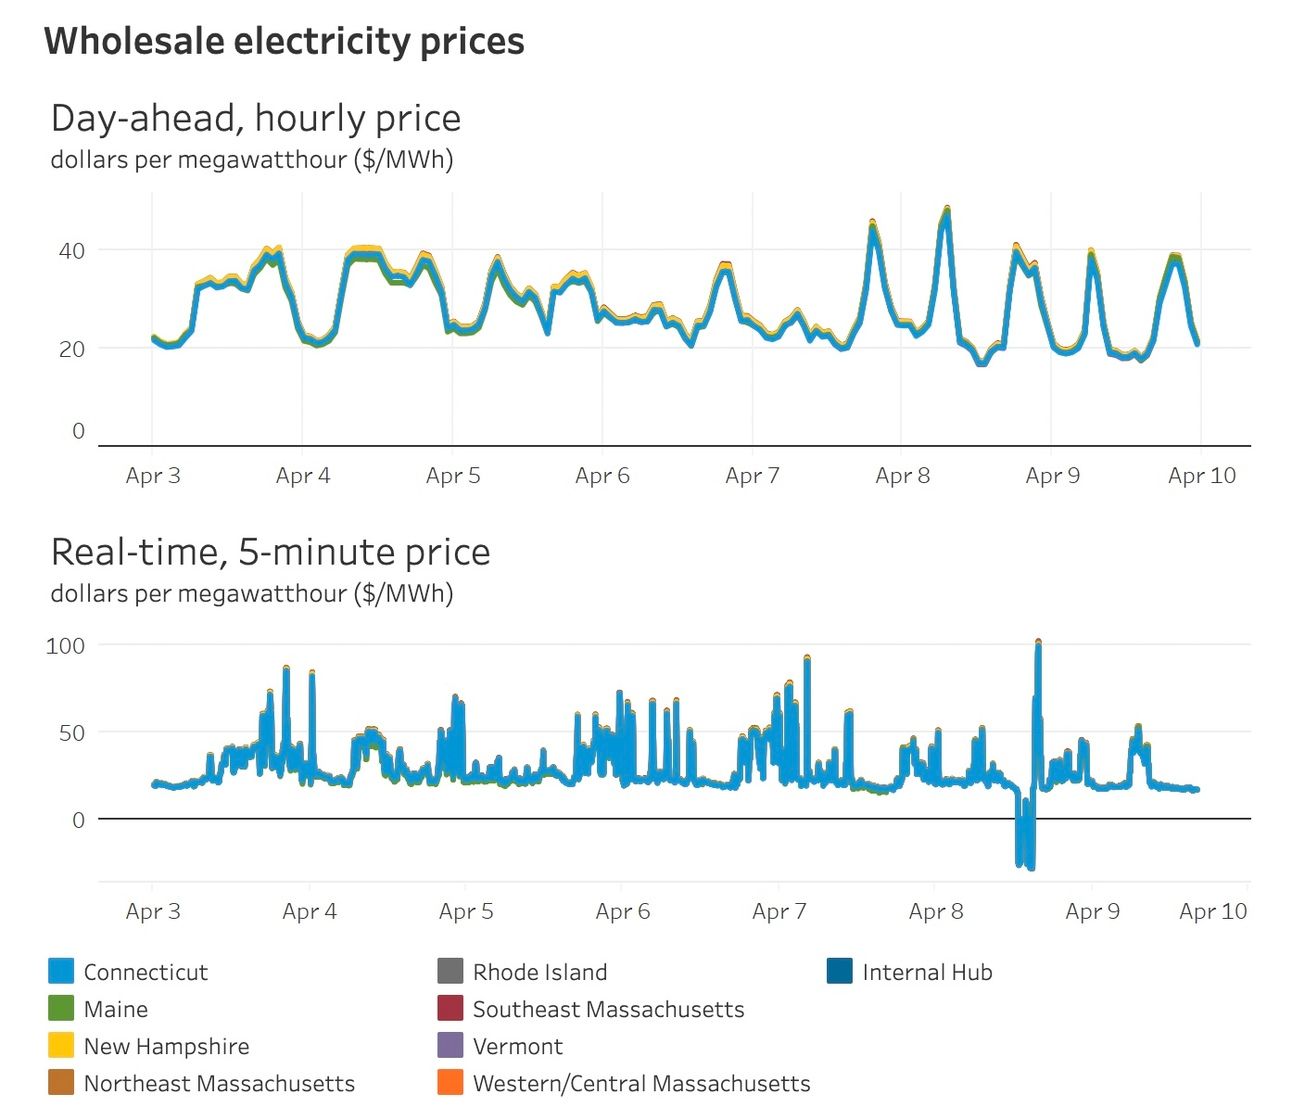
Prices mostly stayed between ~$20/MWh and ~$40/MWh, with real-time prices spanning from the negatives to over $100/MWh. Interestingly, the vault over $100/MWh immediately followed the dip into the negative, perhaps a result of the eclipse on the 8th.
PJM

As for America’s largest power market, natural gas and nuclear maintained their lead. Wind gave coal a little trouble, both otherwise coal held steady at third.
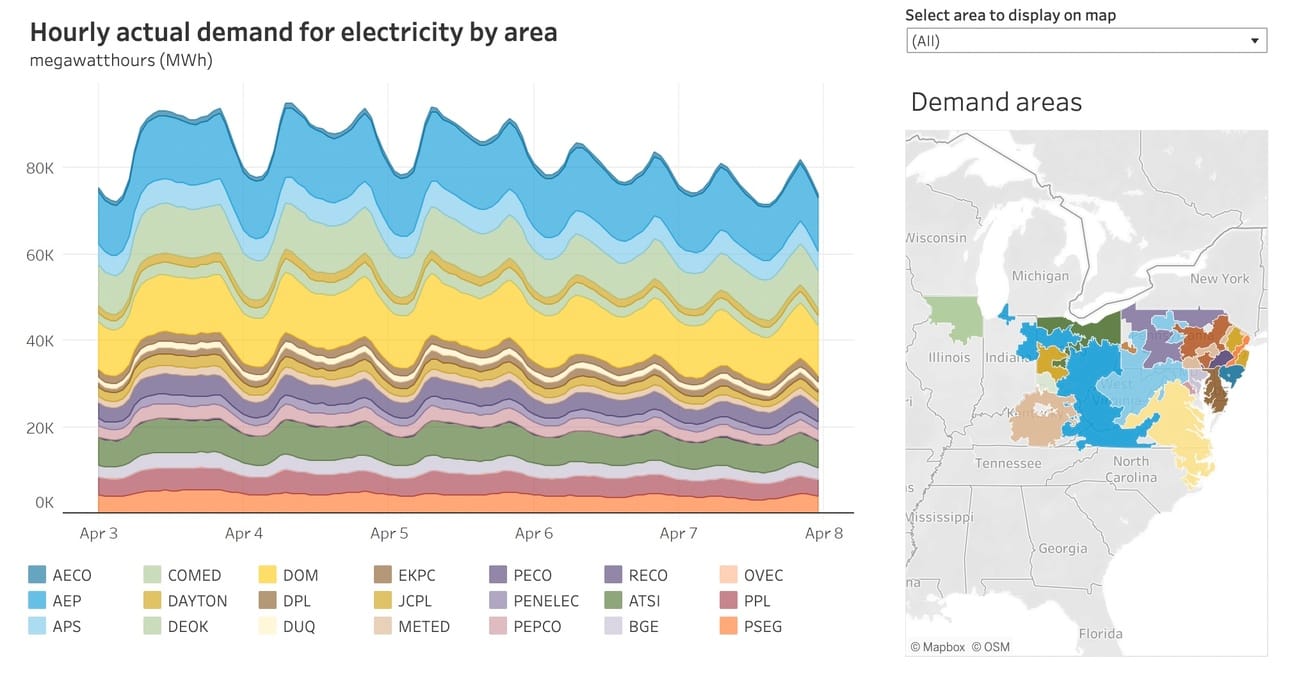
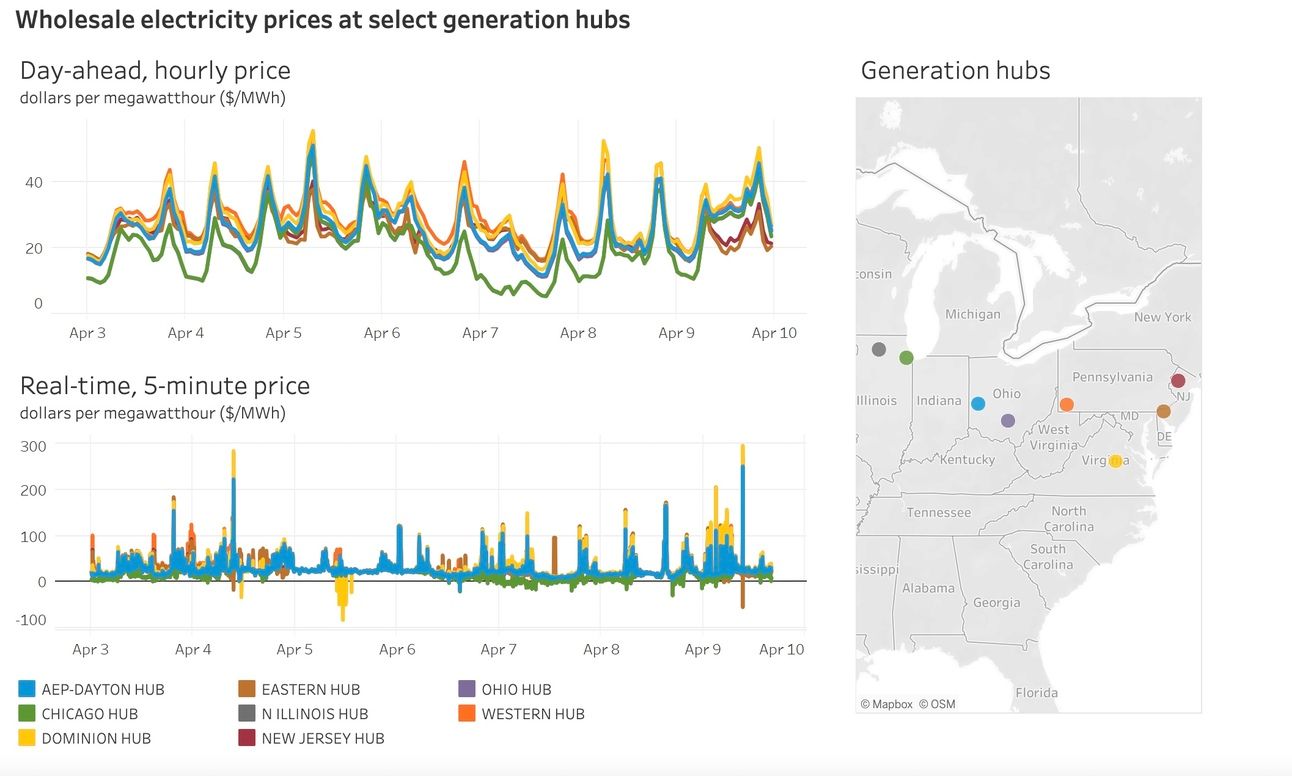
Day-ahead prices were generally consistent across PJM, with nuclear-heavy Chicago as a notably lower-price exception. The same held true in real-time prices, though it was Virginia’s Dominion that dropped deeper into the negatives. But PJM did see real-time prices in Dominion and several other hubs reach to nearly $300/MWh and otherwise well-above day-ahead.
